Replacing Flannel with Calico as CNI in the K3s cluster
Locking down network traffic in the K3s cluster in the homelab has been in the backlog for some time. While not strictly required, I’d rather have a setup more secure by default.
Since K3s ships with Flannel (which does not support NetworkPolicies) as standard I have to switch CNI. After looking at multiple options, I ended up with Calico. Their documentation has a guide specifically for K3s. One feature in particular that caught my attention was Whisker, which is a UI for network flow logs offered in version v3.30 of Calico.
The plan:
- Modify the existing Ansible playbook for K3s to install Calico
- Expose Whisker using an Ingress
- Identify existing network flows to target with NetworkPolicies
- Add NetworkPolicies to the ArgoCD configuration
Modifying the Ansible playbook
New additions to the main inventory file:
inventory.ini:
...
k3s_server_install_args="--disable servicelb --flannel-backend=none --disable-network-policy"
pod_cidr=10.42.0.0/16
The
pod_cidrvariable is now placed in the inventory since it is needed for the Calico configuration later.
The new role install-calico:
roles/install-calico/tasks/main.yaml:
- name: Install Calico
  become: yes
  ansible.builtin.shell: |
    k3s kubectl apply -f https://raw.githubusercontent.com/projectcalico/calico/{{ calico_version }}/manifests/operator-crds.yaml
    k3s kubectl apply -f https://raw.githubusercontent.com/projectcalico/calico/{{ calico_version }}/manifests/tigera-operator.yaml

- name: Wait until Calico crds are installed
  become: yes
  ansible.builtin.shell: k3s kubectl api-resources | grep operator.tigera.io/v1
  register: result
  until: result.stdout.find("Installation") != -1
  retries: 5
  delay: 10

- name: Template out Calico custom-resources.yaml
  ansible.builtin.template:
    src: templates/calico-custom-resources.yaml.j2
    dest: "{{ calico_custom_resources_dest }}"

- name: Apply Calico custom-resources.yaml
  become: yes
  ansible.builtin.command: k3s kubectl apply -f {{ calico_custom_resources_dest }}

- name: Enable Felix metrics
  become: yes
  ansible.builtin.command: |
    k3s kubectl patch felixconfiguration default --type merge --patch '{"spec":{"prometheusMetricsEnabled": true}}'
roles/install-calico/templates/calico-custom-resources.yaml.j2:
# This section includes base Calico installation configuration.
# For more information, see: https://docs.tigera.io/calico/latest/reference/installation/api#operator.tigera.io/v1.Installation
apiVersion: operator.tigera.io/v1
kind: Installation
metadata:
  name: default
spec:
  # Configures Calico networking.
  calicoNetwork:
    bgp: Disabled
    ipPools:
    - name: default-ipv4-ippool
      blockSize: 26
      cidr: {{ pod_cidr }}
      encapsulation: VXLANCrossSubnet
      natOutgoing: Enabled
      nodeSelector: all()
  typhaMetricsPort: 9093
---

# This section configures the Calico API server.
# For more information, see: https://docs.tigera.io/calico/latest/reference/installation/api#operator.tigera.io/v1.APIServer
apiVersion: operator.tigera.io/v1
kind: APIServer
metadata:
  name: default
spec: {}

---

# Configures the Calico Goldmane flow aggregator.
apiVersion: operator.tigera.io/v1
kind: Goldmane
metadata:
  name: default

---

# Configures the Calico Whisker observability UI.
apiVersion: operator.tigera.io/v1
kind: Whisker
metadata:
  name: default
roles/install-calico/vars/main.yaml:
calico_version: v3.30.2
calico_custom_resources_dest: /tmp/calico-custom-resources.yaml
Output after recreating the VMs of the nodes in Proxmox and reinstalling K3s using the new playbook:
kubectl get pods -n calico-system
NAME                                      READY   STATUS    RESTARTS     AGE
calico-kube-controllers-f979cd594-pdwl7   1/1     Running   0            58d
calico-node-grhjn                         1/1     Running   0            51d
calico-node-hgw28                         1/1     Running   2 (8d ago)   51d
calico-node-nhtwk                         1/1     Running   0            51d
calico-node-qxm97                         1/1     Running   1 (8d ago)   51d
calico-node-tgf2v                         1/1     Running   0            51d
calico-node-tzxgc                         1/1     Running   0            51d
calico-node-vwczl                         1/1     Running   0            51d
calico-typha-588c846999-8jn4f             1/1     Running   0            53d
calico-typha-588c846999-mkzjb             1/1     Running   0            53d
calico-typha-588c846999-sfpmm             1/1     Running   0            8d
csi-node-driver-9jnqc                     2/2     Running   0            58d
csi-node-driver-nwwhs                     2/2     Running   0            58d
csi-node-driver-r72m4                     2/2     Running   2 (8d ago)   58d
csi-node-driver-s6rf4                     2/2     Running   0            58d
csi-node-driver-sd2g8                     2/2     Running   0            58d
csi-node-driver-vvndc                     2/2     Running   0            58d
csi-node-driver-z62lp                     2/2     Running   0            58d
goldmane-64584db4cf-26bdg                 1/1     Running   0            58d
whisker-98dff96db-t78nq                   2/2     Running   0            58d
Exposing Whisker
With Calico up and running I added an Ingress and a NetworkPolicy to the ArgoCD configuration to expose Whisker:
apiVersion: networking.k8s.io/v1
kind: NetworkPolicy
metadata:
  name: allow-traefik-to-whisker
spec:
  ingress:
  - from:
    - namespaceSelector:
        matchLabels:
          kubernetes.io/metadata.name: kube-system
      podSelector:
        matchLabels:
          app.kubernetes.io/name: traefik
    ports:
    - port: 8081
      protocol: TCP
  podSelector:
    matchLabels:
      app.kubernetes.io/name: whisker
  policyTypes:
  - Ingress
apiVersion: networking.k8s.io/v1
kind: Ingress
metadata:
  annotations:
    cert-manager.io/issuer: step-issuer
    cert-manager.io/issuer-group: certmanager.step.sm
    cert-manager.io/issuer-kind: StepClusterIssuer
  name: whisker
spec:
  rules:
  - host: whisker.homelab.fredrickb.com
    http:
      paths:
      - backend:
          service:
            name: whisker
            port:
              number: 8081
        path: /
        pathType: Prefix
  tls:
  - hosts:
    - whisker.homelab.fredrickb.com
    secretName: whisker-tls-cert
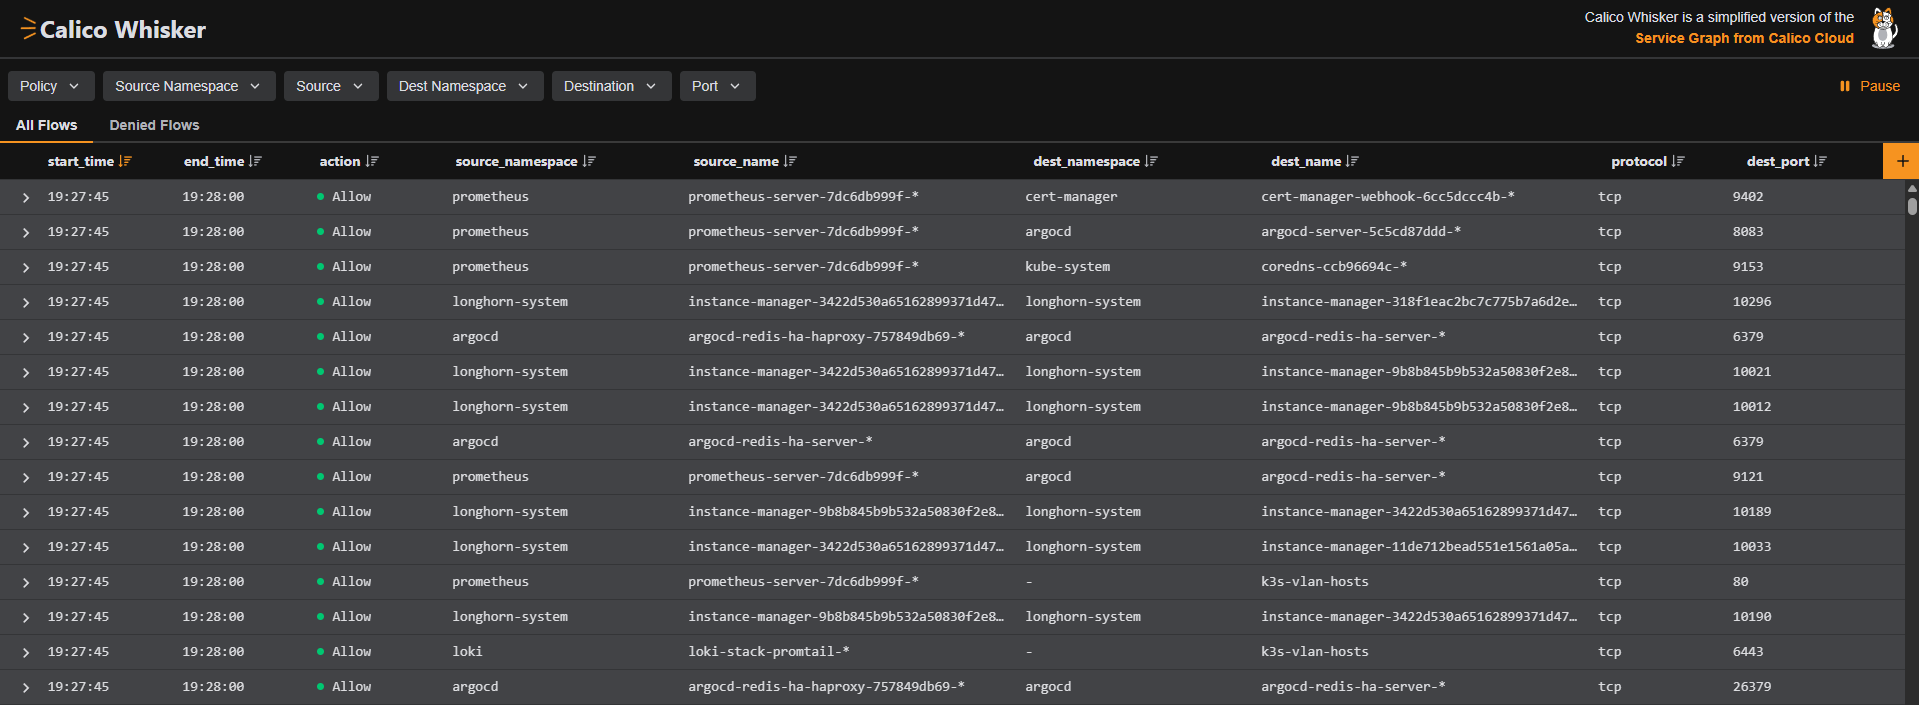
After applying changes with ArgoCD:
Locking down network traffic
I repeated the following steps until all network traffic was covered by a NetworkPolicy:
- Identify traffic for NetworkPolicies using Whisker
- Label known IP-ranges outside of K3s using GlobalNetworkSets/NetworkSets
- Dry-run NetworkPolicies before enforcing them using StagedGlobalNetworkPolicies/ StagedNetworkPolicies
I created GlobalNetworkSets for systems external to the cluster such as Proxmox and GitHub Actions self-hosted runner hosts:
apiVersion: projectcalico.org/v3
kind: GlobalNetworkSet
metadata:
  name: proxmox-hosts
  labels:
    name: proxmox-hosts
    node-exporter: "true"
    process-exporter: "true"
    promtail: "true"
spec:
  nets:
    - 10.0.2.0/24
apiVersion: projectcalico.org/v3
kind: GlobalNetworkSet
metadata:
  name: github-actions-runner-hosts
  labels:
    node-exporter: "true"
    process-exporter: "true"
    promtail: "true"
spec:
  nets:
    - 10.0.7.0/24
These GlobalNetworkSets were referenced in Calico NetworkPolicies using labels to allow traffic from Prometheus in the cluster to services such as node_exporter:
apiVersion: projectcalico.org/v3
kind: NetworkPolicy
metadata:
  name: allow-egress-to-node-exporter-hosts
  namespace: prometheus
spec:
  types:
  - Egress
  egress:
  - action: Allow
    protocol: TCP
    destination:
      namespaceSelector: global()
      selector: node-exporter == "true"
      ports:
      - 9100
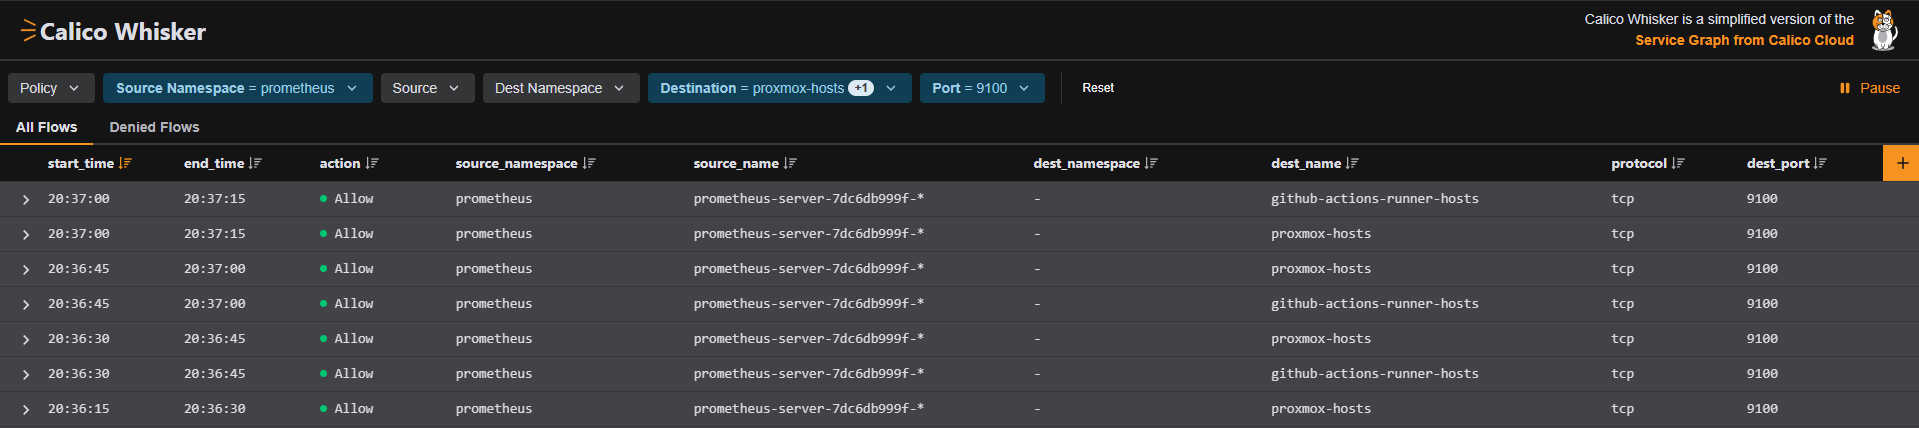
Names of GlobalNetworkSets are reflected in the column dest_name in
Whisker when inspecting traffic from Prometheus running in K3s to Proxmox
and GitHub Actions self-hosted runner hosts on port 9100:
One thing I was hoping to avoid was the need to have a NetworkPolicy in every namespace to allow traffic between workloads. I did not find a way to cover this use-case with GlobalNetworkPolicies. I had to duplicate the following NetworkPolicy in all namespaces to achieve the correct behaviour:
apiVersion: projectcalico.org/v3
kind: NetworkPolicy
metadata:
  name: allow-same-namespace
  namespace: <namespace>
spec:
  types:
    - Egress
    - Ingress
  egress:
    - action: Allow
      source:
        namespaceSelector: kubernetes.io/metadata.name == "<namespace>"
      destination:
        namespaceSelector: kubernetes.io/metadata.name == "<namespace>"
  ingress:
    - action: Allow
      source:
        namespaceSelector: kubernetes.io/metadata.name == "<namespace>"
      destination:
        namespaceSelector: kubernetes.io/metadata.name == "<namespace>"
Example from the Grafana namespace:
apiVersion: projectcalico.org/v3
kind: NetworkPolicy
metadata:
  name: allow-same-namespace
  namespace: grafana
spec:
  types:
  - Egress
  - Ingress
  egress:
  - action: Allow
    source:
      namespaceSelector: kubernetes.io/metadata.name == "grafana"
    destination:
      namespaceSelector: kubernetes.io/metadata.name == "grafana"
  ingress:
  - action: Allow
    source:
      namespaceSelector: kubernetes.io/metadata.name == "grafana"
    destination:
      namespaceSelector: kubernetes.io/metadata.name == "grafana"
There are a couple of issues addressing this already, so we’ll see if this improves in the future:
Monitoring Calico
Calico ships with metrics that can be scraped using Prometheus (more details on monitoring here).
I added the necessary services for Felix and Typha to expose their metrics:
apiVersion: v1
kind: Service
metadata:
  name: felix-metrics-svc
  namespace: calico-system
spec:
  clusterIP: None
  selector:
    k8s-app: calico-node
  ports:
  - port: 9091
    targetPort: 9091
apiVersion: v1
kind: Service
metadata:
  name: typha-metrics-svc
  namespace: calico-system
spec:
  clusterIP: None
  selector:
    k8s-app: calico-typha
  ports:
  - port: 9093
    targetPort: 9093
The updated scrape config in Prometheus, copied from the documentation:
...
extraScrapeConfigs: |
  ...
  - job_name: 'felix_metrics'
    scrape_interval: 5s
    scheme: http
    kubernetes_sd_configs:
    - role: endpoints
    relabel_configs:
    - source_labels: [__meta_kubernetes_service_name]
      regex: felix-metrics-svc
      replacement: $1
      action: keep

  - job_name: 'typha_metrics'
    scrape_interval: 5s
    scheme: http
    kubernetes_sd_configs:
    - role: endpoints
    relabel_configs:
    - source_labels: [__meta_kubernetes_service_name]
      regex: typha-metrics-svc
      replacement: $1
      action: keep
    - source_labels: [__meta_kubernetes_pod_container_port_name]
      regex: calico-typha
      action: drop

  - job_name: 'kube_controllers_metrics'
    scrape_interval: 5s
    scheme: http
    kubernetes_sd_configs:
    - role: endpoints
    relabel_configs:
    - source_labels: [__meta_kubernetes_service_name]
      regex: calico-kube-controllers-metrics
      replacement: $1
      action: keep
The documentation offers some premade Grafana dashboards nested in a ConfigMap here,
but they’ll need a small adjustment. I extracted the JSON payloads and replaced the
hardcoded value of datasource.uid with $datasource:
From this:
...
"datasource": {
  "type": "prometheus",
  "uid": "<Some-UID>"
},
...
To this:
...
"datasource": {
  "type": "prometheus",
  "uid": "$datasource"
},
...
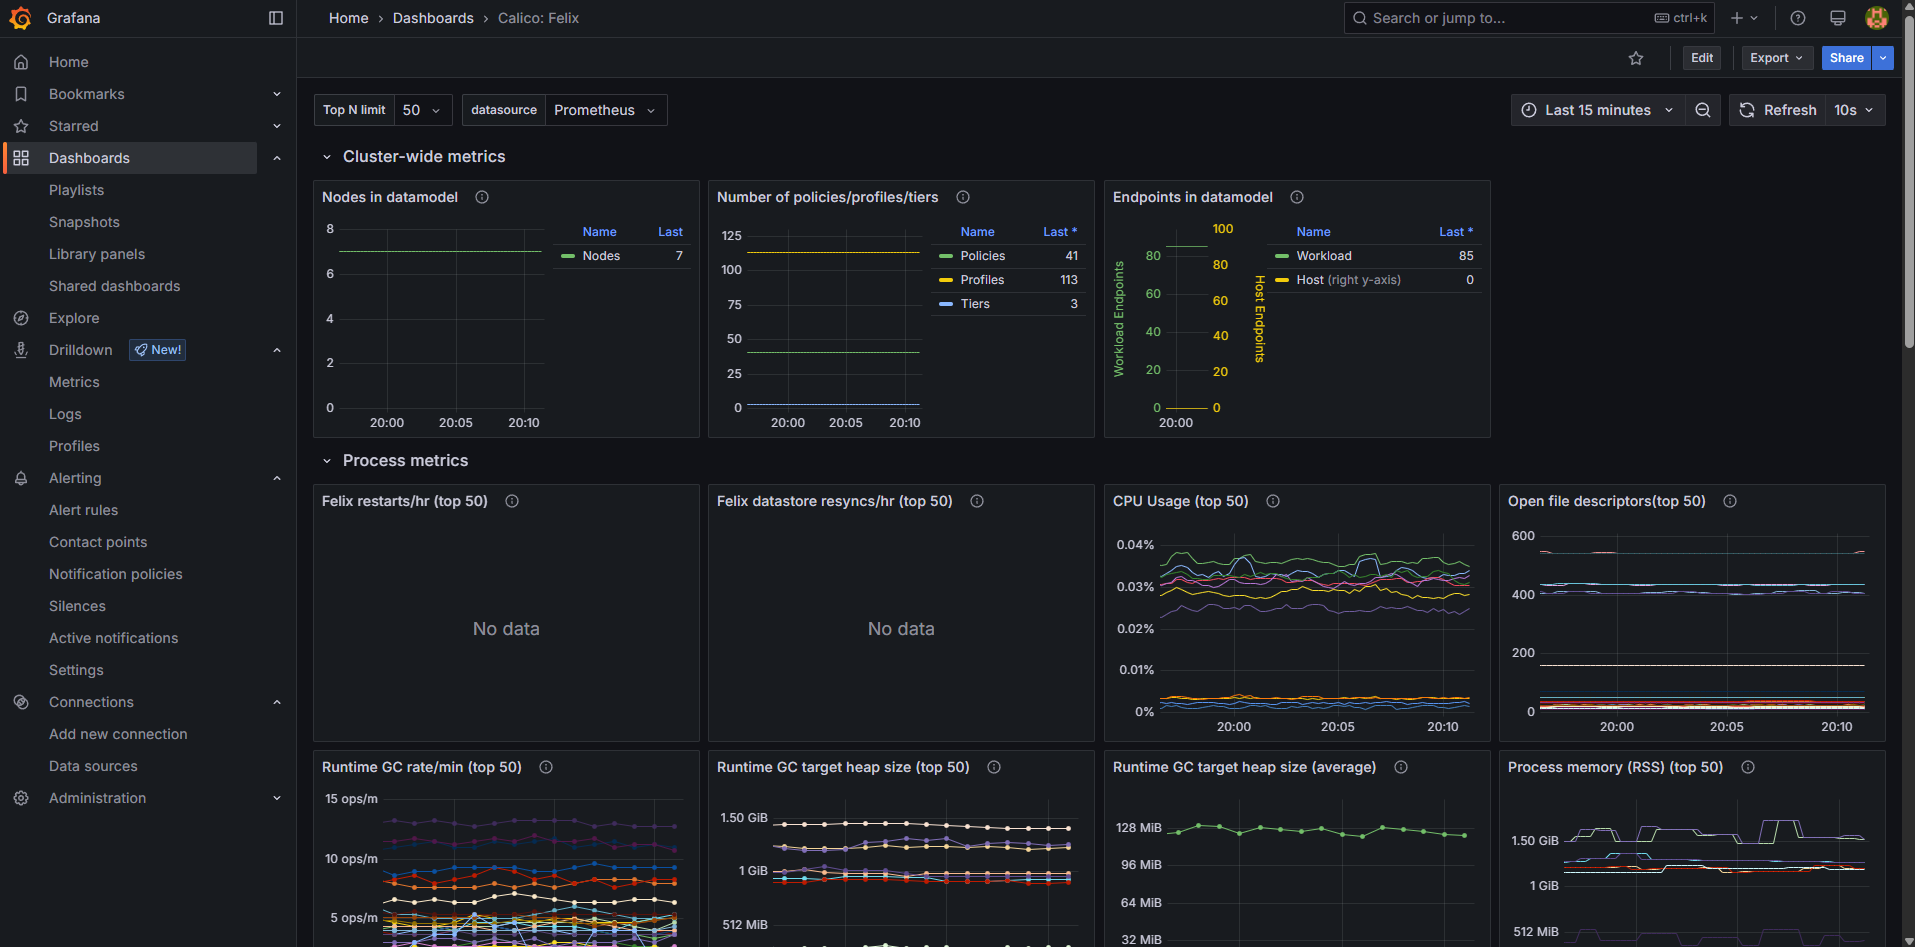
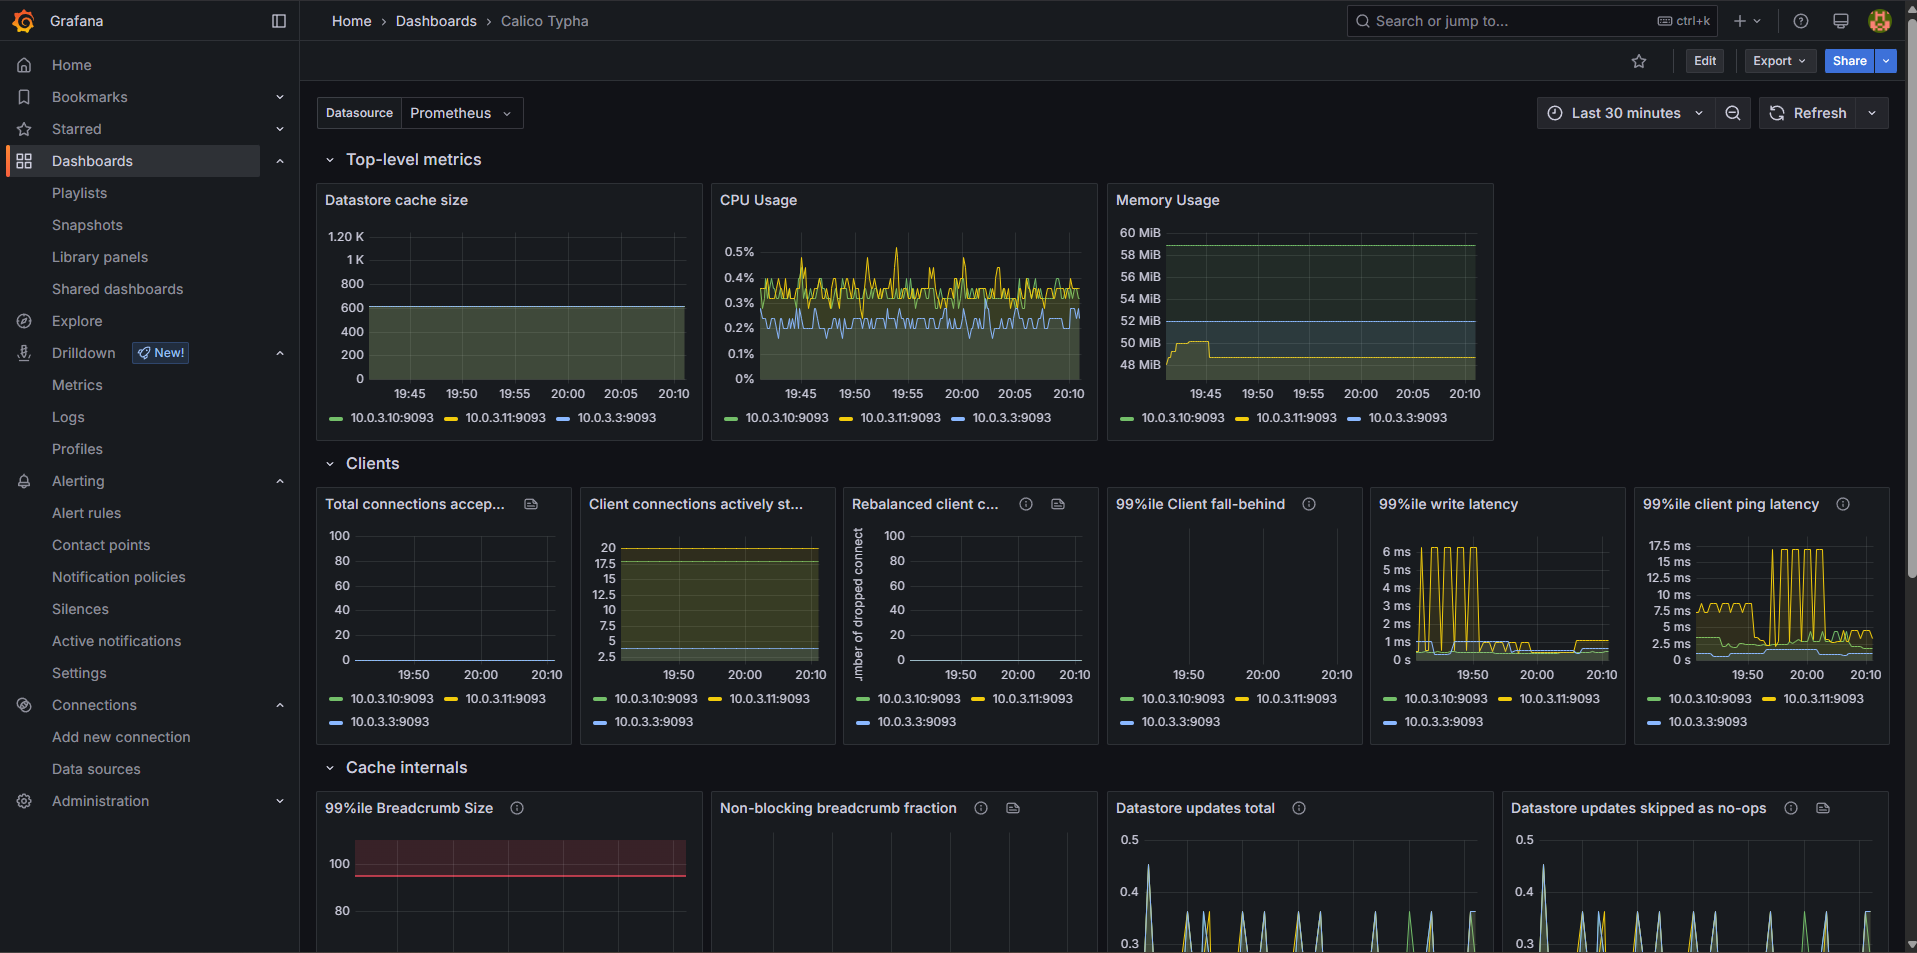
Once done, I had Grafana dashboards showing the status of components Felix and Typha:
Conclusion
All network traffic within the cluster and to systems external to the cluster is now locked down with NetworkPolicies. While I initially planned to stick with standard NetworkPolicies, the Calico NetworkPolicies provide more control and flexibility.
I really like the combination of Whisker, (Global)NetworkSets and Staged(Global)NetworkPolicies. You get tools to identify active network flows, label specific IP-ranges/hosts and dry-run NetworkPolicies before enforcing them. This helps a lot when retroactively locking down network traffic in a cluster that already has a lot of services running.
In terms of observability, there are Prometheus metrics and predefined Grafana dashboards available for Felix and Typha.
Network traffic in the cluster is now secure by default for current and future workloads.