Introducing Proxmox to the homelab
Last year I had to accept that the
Raspberry Pi 3B+ nodes in the Kubernetes cluster was
struggling to keep up with the workloads they were being scheduled
(see Recreating the Raspberry Pi homelab with Kubernetes).
It was beginning to affect the stability of the cluster.
Not to mention that running purely on ARM nodes means I’ve seen my
fair share of Exec format error.
I had to find something more sustainable. Preferably, nodes should be defined using IaC, and all interactions occurring through an API.
Proxmox
Enter Proxmox. Proxmox has a big community and there is a lot of resources in homelab circles, making troubleshooting and finding integrations easier.
Some of the benefits of using Proxmox on my part:
- I can create, modify and destroy nodes without the need for physical interaction with the host. It’s all managed through the API or UI
- IaC using the Proxmox Terraform provider
I built a Proxmox host using some spare hardware I had laying around. The host doesn’t have great specs (4 cores, 16GB Memory), but Proxmox has very little overhead and will run on most hardware.
Screenshot of the dashboard combined with the unofficial dark mode theme:

Automating the setup of hosts
As with most things in the homelab, automating the setup is a necessity to avoid remembering details or writing longer instructions for later. Plus, I like automating stuff.
The result is an Ansible playbook which automates everything I need post-install. Some of the tasks involved:
- Expose metrics from the host with Node exporter and Proxmox exporter
- Setup ACME for automatic certificate provisioning for the internal domain of the web UI with a custom CA
- Setup dark mode theme for the web UI
- Download cloud-init ISO images, then create VM templates using those images
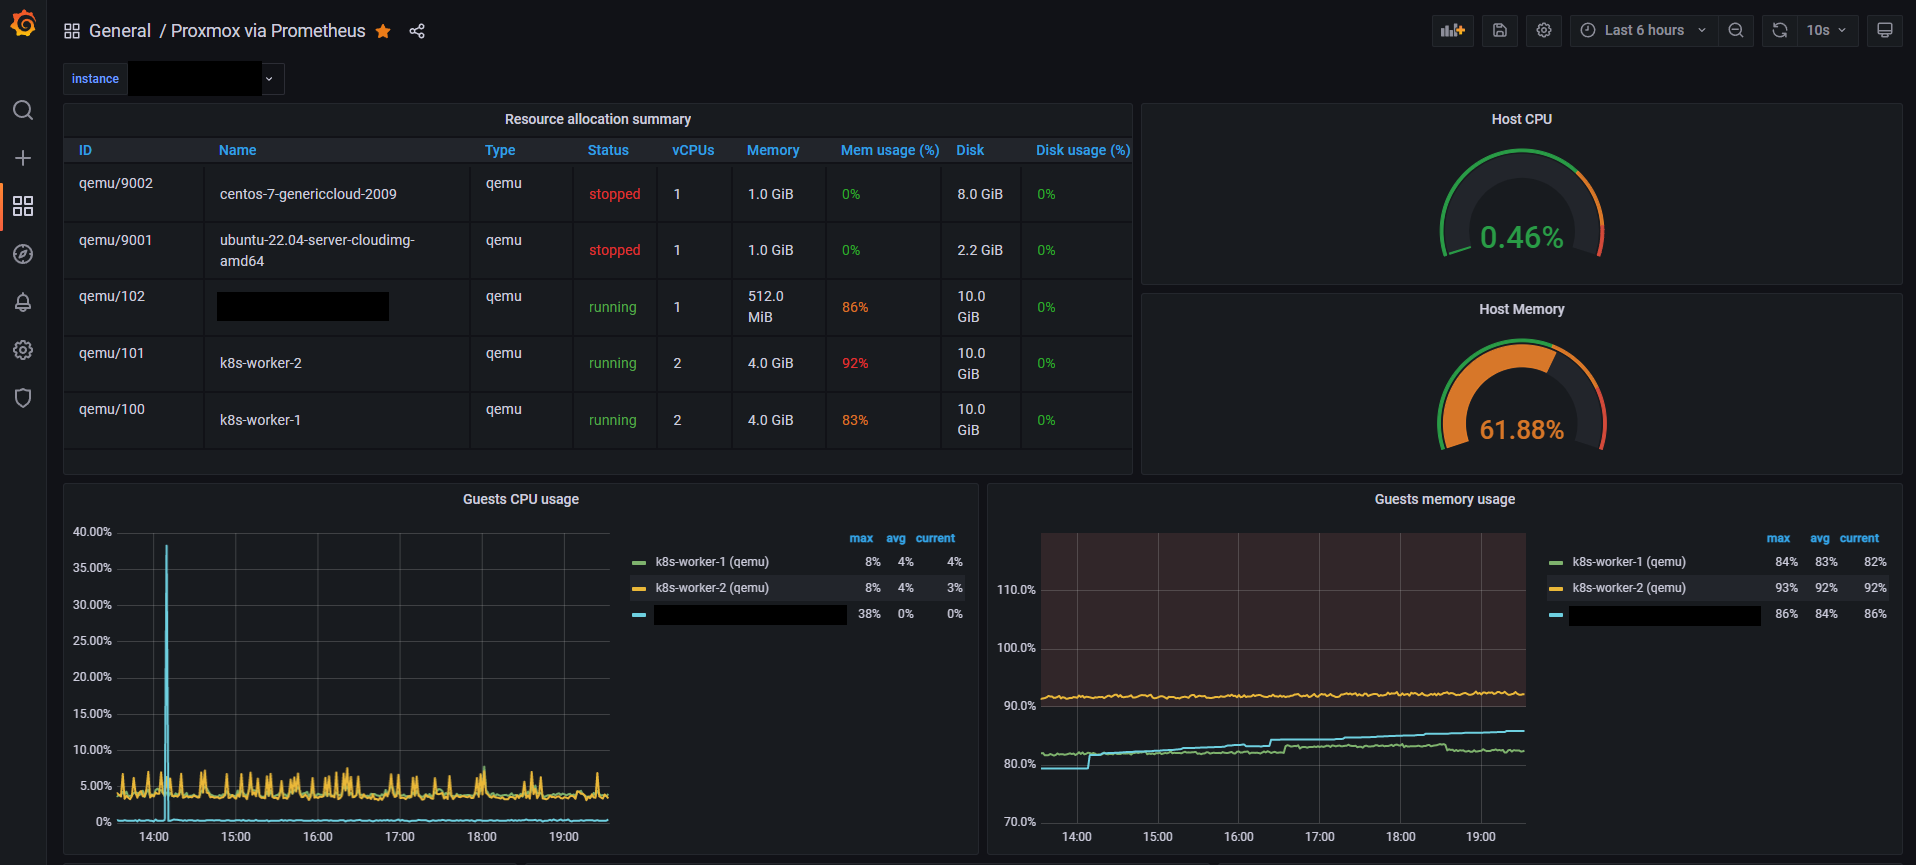
Proxmox exporter and Grafana dashboard
Combining the Proxmox exporter with the Grafana dashboard provides a nice way of representing the state of running workloads. This integrates great with my existing monitoring stack. I’ve tweaked the Grafana dashboard slightly in my case, the official version looks a bit different.
Conclusion
I have replaced all Raspberry Pi 3B+ nodes in the Kubernetes cluster with VMs defined as Terraform config checked into a repository on GitHub. The VMs all use the VM templates created from cloud-init ISO-images, meaning there is no manual input required.
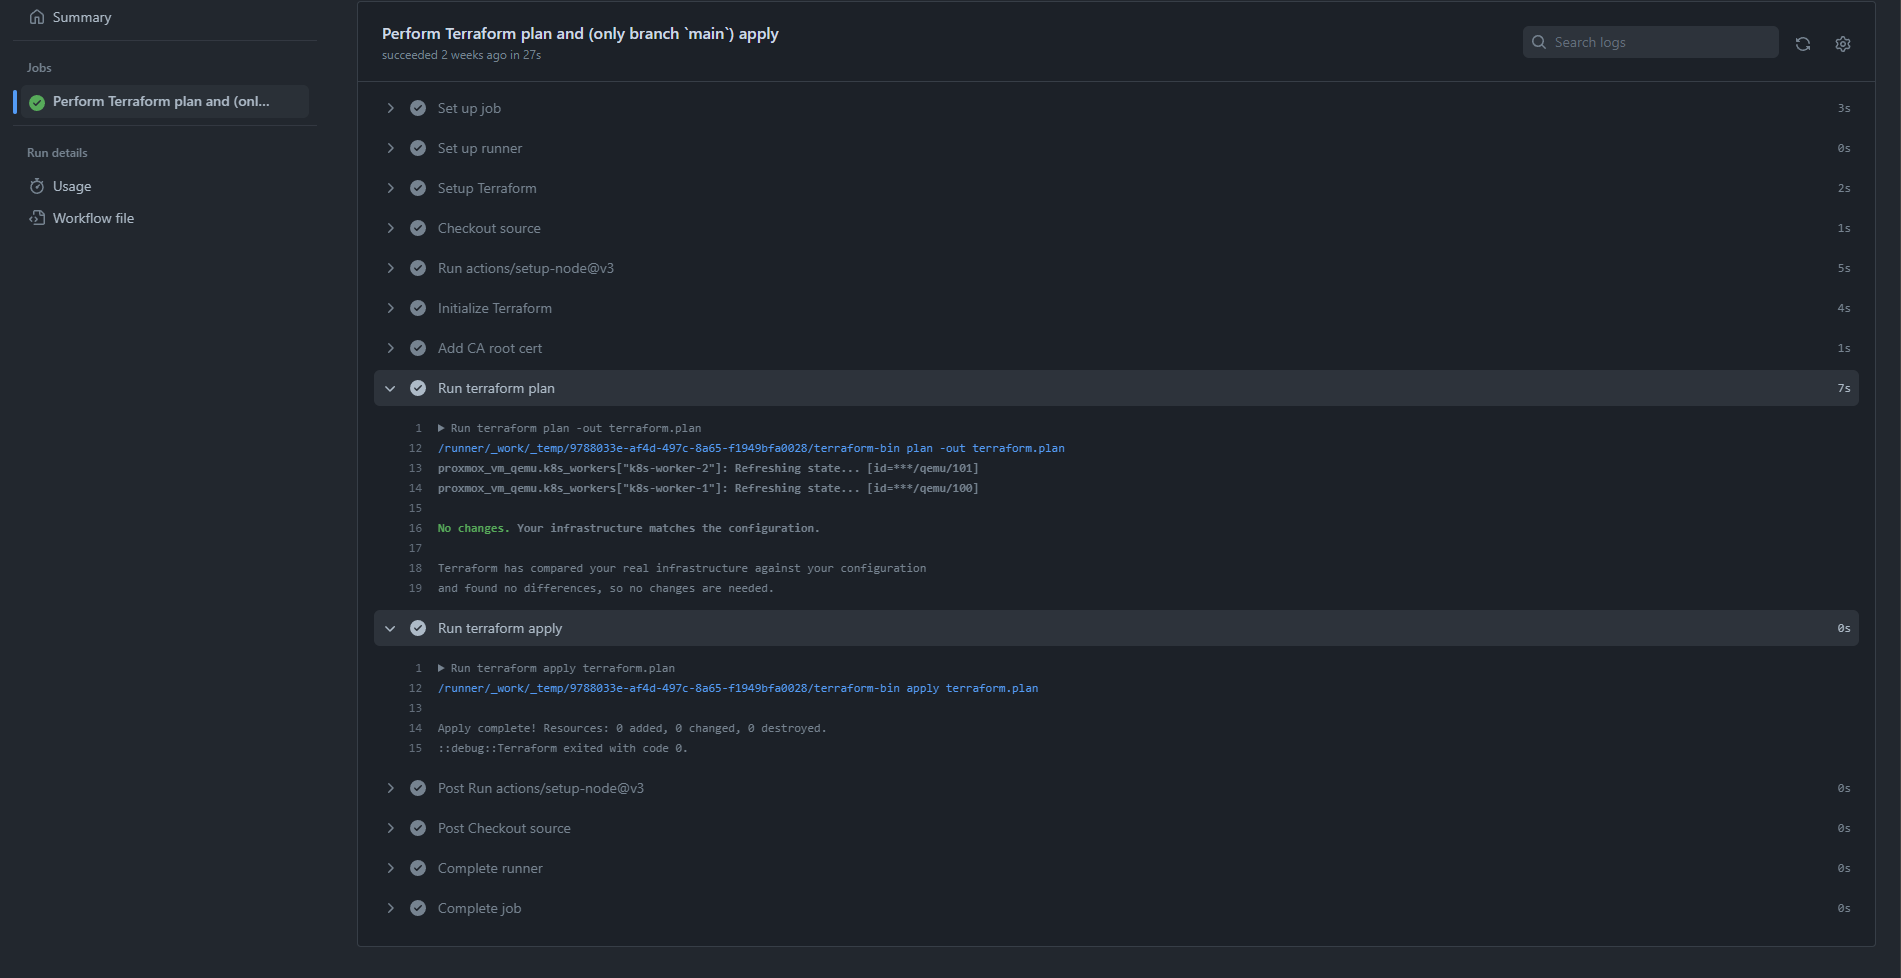
The repository uses GitHub Actions and self-hosted runners to deploy any configuration changes to the API endpoint of the Proxmox host in the homelab. Proxmox then applies the new configuration and reboots the VMs if necessary.
Example of an automated deployment:
I have been running the Kubernetes cluster across a hybrid of 2x Raspberry Pi 4B and 2x VMs for a few months now, and so far the experience has been great. It solved the resource and stability issues I had previously. An added bonus is that I now have the option to deploy workloads that don’t support ARM, and also workloads which require more resources. Workloads that cannot run as containers in Kubernetes can now be placed outside the cluster on standalone VMs.
Looking forward to tinker with this setup even more to see what else is possible.